Hive Hive
Sign in

feat: module cache network analytics (bandwidth + overall fetch time)

GitHub issue · Closed

Metadata
Source
tuist/tuist #11619
Updated
Jul 5, 2026
Domains
Cache
Details

What

Per-run module cache network analytics: for every run, see how much data the module (binary) cache moved and how fast, right next to its hit rate.
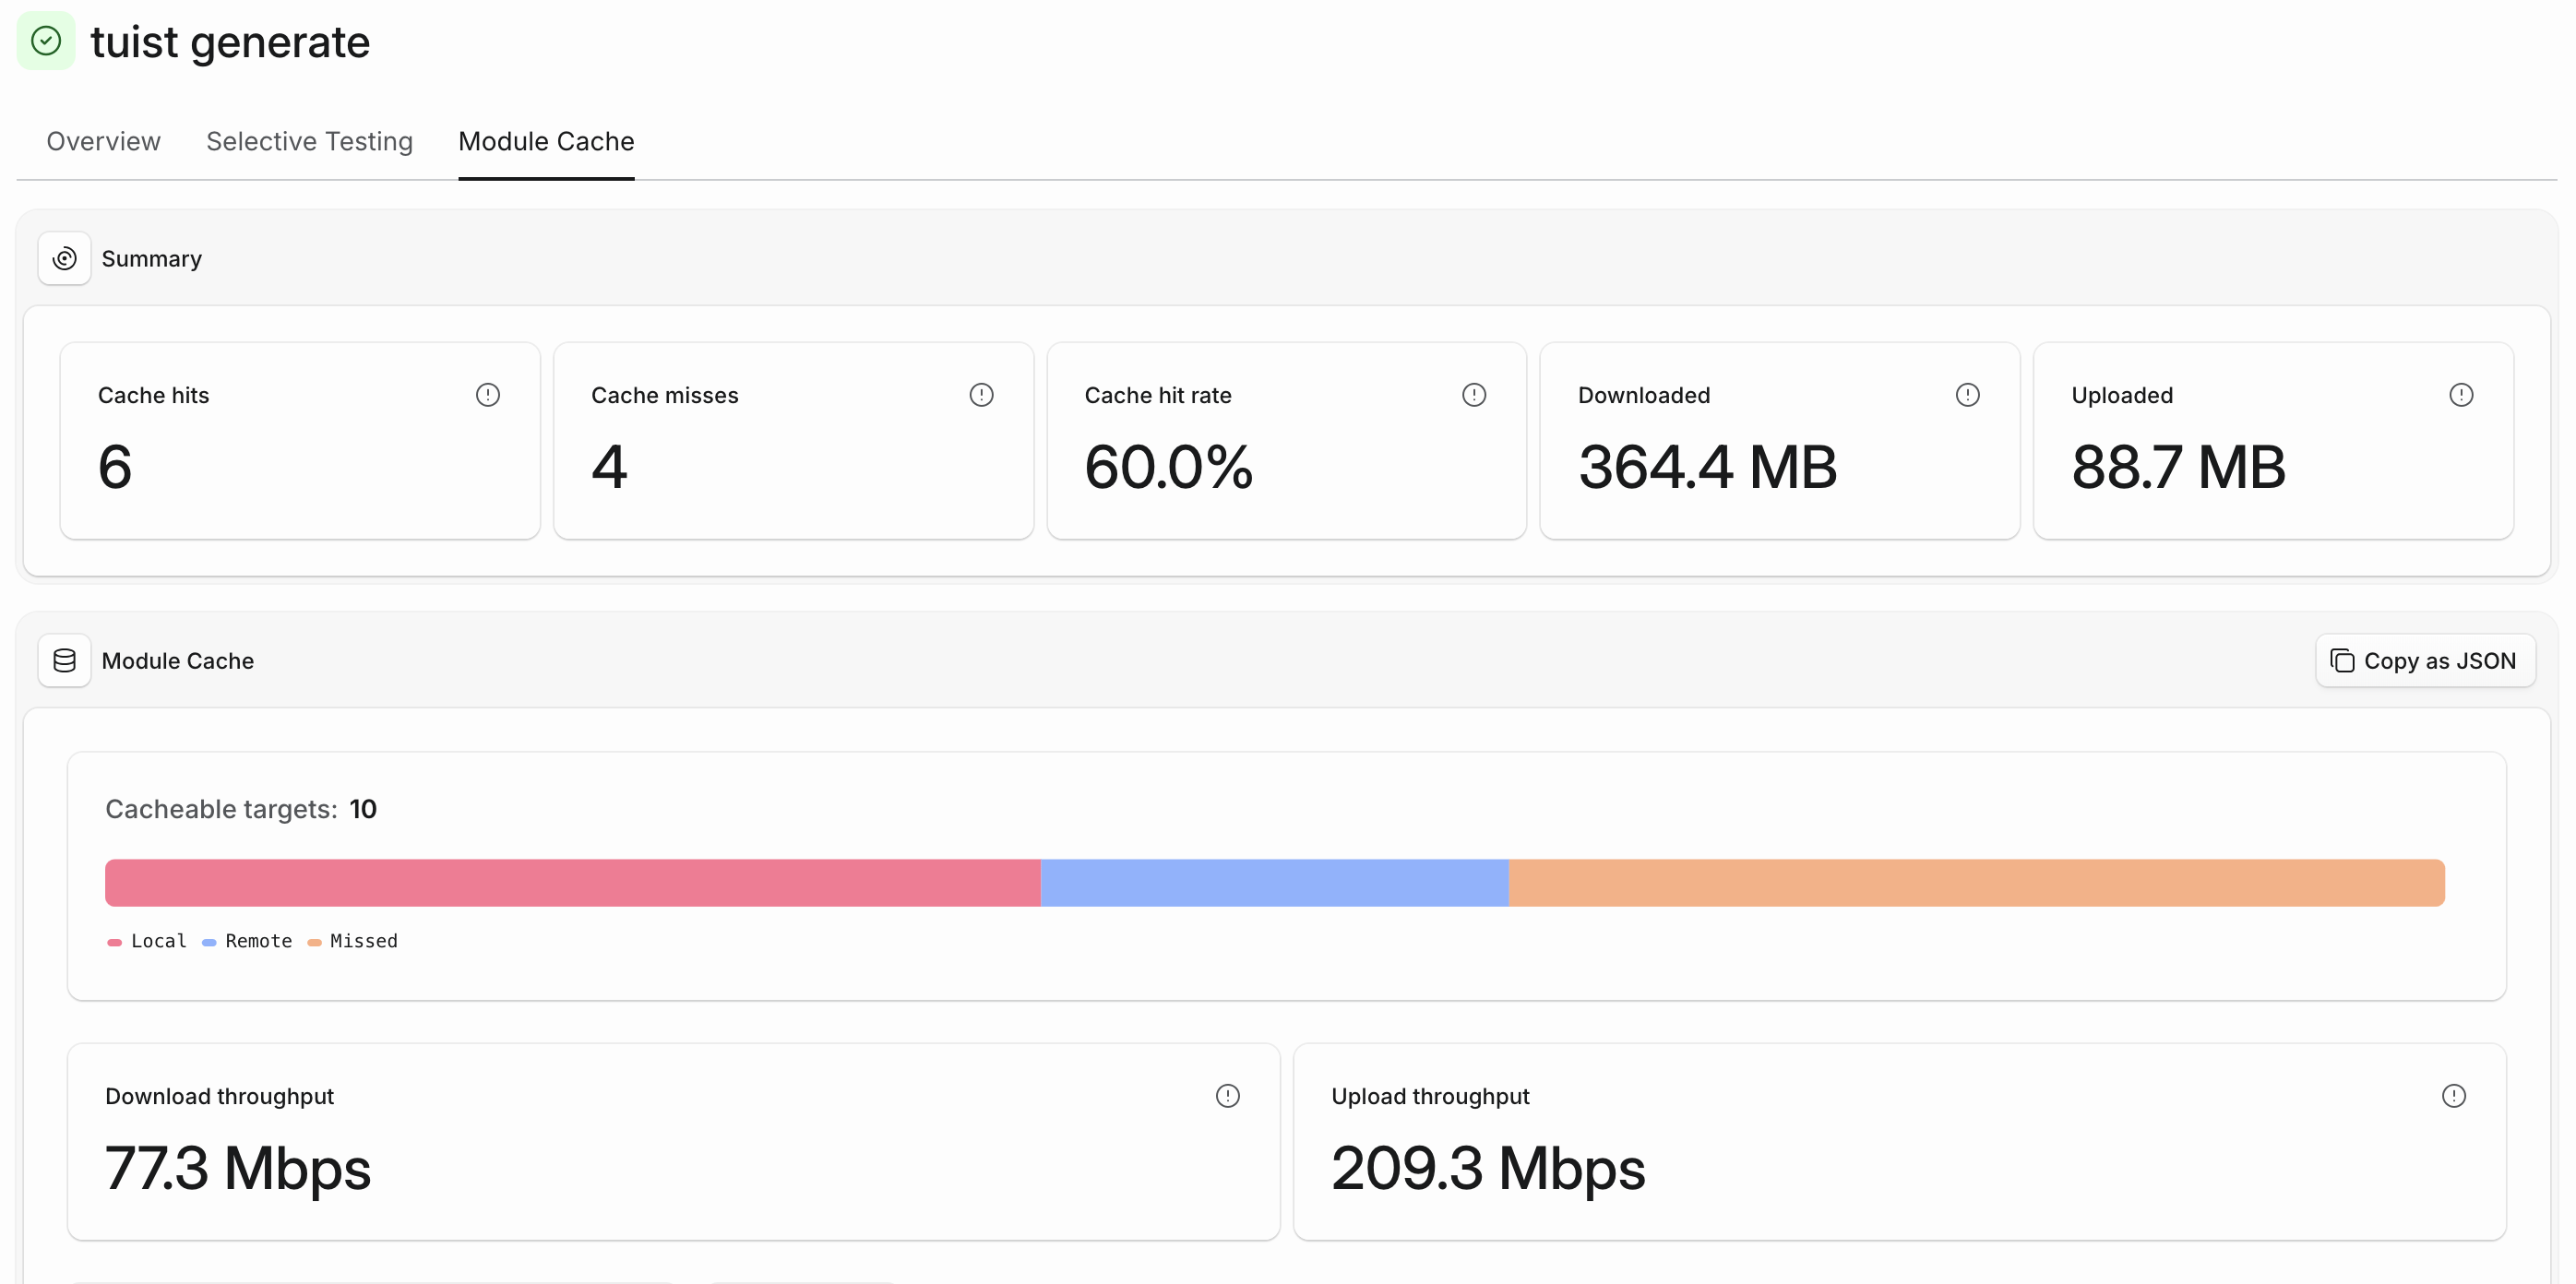
The Module Cache tab of a tuist generate run: Downloaded and Uploaded totals alongside cache hits, misses, and hit rate, with Download and Upload throughput below the cacheable targets breakdown

On a run’s Module Cache tab:

  • Downloaded / Uploaded (Summary card) — total bytes of prebuilt modules the run pulled from and pushed to the remote cache.
  • Download / Upload throughput (Module Cache card) — time-weighted average transfer speed, matching the Xcode Cache (CAS Outputs) layout.

Why

Hit rate tells you how many modules you skipped rebuilding; it doesn’t tell you what the cache cost over the wire. When evaluating or optimizing the module cache (especially on CI), the artifact fetch is usually the remaining lever: a slow or partial remote fetch shows up as a run-to-run outlier. These numbers make the network side visible per run, so a slow-fetch run points at itself.

How it works

  • The CLI reports per-artifact transfers (operation, size, compressed size, duration) on the command event as module_cache_transfers. The remote-cache-storage instrumentation that records them lives in TuistCacheEE (companion PR: tuist/TuistCacheEE#68).
  • The server ingests them into a module_cache_outputs ClickHouse table keyed by command_event_id. It can’t reuse cas_outputs (build-run-scoped): the module cache is fetched during tuist generate, before any build run exists. This mirrors how cas_outputs ride the POST /builds payload: the same flat per-artifact list, attached to whichever run entity exists for that command.
  • CommandEvents.module_cache_transfer_summary/1 derives download/upload counts, bytes, and time-weighted throughput per run, a direct analog of Tuist.Builds.cas_output_metrics/1.
  • Surfaced on the run detail Module Cache tab (a shared component, so it reaches build and test runs too).

Scope note

An earlier iteration explored aggregate transfer/latency/throughput/fetch-time widgets on the Module Cache overview page; that was removed in favor of the per-run view above (the overview is back to hit-rate/hits/misses), and overall fetch-time tracking was dropped entirely. See the PR comments for the full evolution.

Validation

  • Server compiles clean; mix format + Credo consistent; OpenAPI client regenerated.
  • Tests for the ingest path and module_cache_transfer_summary/1 (counts, bytes, and throughput).
  • Verified end-to-end on a local instance: the run detail Module Cache tab renders the Summary and throughput widgets from seeded module_cache_outputs data (screenshot above).

Companion

  • TuistCacheEE instrumentation: tuist/TuistCacheEE#68. It must land together, since it fills the ModuleCacheTransfer sink the server reads from.

🤖 Generated with Claude Code

Flights

Investigate, reproduce, or fix this item in an isolated repository. Each Flight preserves its outcome and agent session.

New Flights are paused Configure model inference, GitHub, and a sandbox provider to start another Flight. Existing results remain available below.
No Flights yet

Start a Flight and preserve its objective, outcome, and session here.

Comments
F
fortmarek Jul 2, 2026

Companion EE PR + dashboard polish

  • Companion instrumentation PR: tuist/TuistCacheEE#68 — records the per-artifact download/upload transfers and the overall fetch-batch wall-clock from ModuleCacheRemoteStorage. It’s the data source for this PR and should land together with (or just after) it.
  • Dashboard polish (added in feat(server): make module cache network widgets interactive…): the Transfer / Latency / Throughput widgets now have a combined / downloads / uploads toggle (read/write for latency), and all four network widgets (incl. Fetch time) are selectable and drive the analytics time-series chart. The hit-rate/hits/misses and network analytics are now computed in a single async assign so the chart can plot any metric.
F
fortmarek Jul 2, 2026

Changed approach: per-run detail, not overview aggregates

Based on feedback, the module cache network numbers now live on the run detail page rather than as aggregate widgets on the Module Cache overview.

  • Reverted the overview Module Cache page back to hit-rate / hits / misses only (removed the Transfer / Latency / Throughput / Fetch-time trend widgets, the download/upload toggles, the chart wiring, and the generalized period-aggregate analytics).
  • Added a per-command-event query CommandEvents.module_cache_transfer_summary/1 over module_cache_outputs + module_cache_transfer_durations.
  • The run detail page’s Module Cache tab → Summary card now shows that run’s own Downloaded, Uploaded, and Fetch time. This is the right altitude for spotting a slow-fetch outlier on the exact run that caused it (verified locally with a seeded 16m 45s run).

The data pipeline is unchanged — CLI capture, EE instrumentation, and server ingest into the two ClickHouse tables all stay. Only the read/presentation side moved from aggregate to per-run.

F
fortmarek Jul 2, 2026

Dropped fetch time, added download/upload throughput

Per feedback, removed overall fetch-time tracking entirely and replaced the per-run Fetch time widget with Download/Upload throughput, matching the Xcode Cache (CAS Outputs) tab.

  • Removed the module_cache_transfer_durations table + schema + buffer + ingest, the CLI’s per-run wall-clock scalar and its OpenAPI field (regenerated), and the EE fetch-batch measurement. Net simplification.
  • CommandEvents.module_cache_transfer_summary/1 now returns download/upload counts, bytes, and time-weighted average throughput, mirroring Tuist.Builds.cas_output_metrics/1 — all derived from module_cache_outputs.
  • The run detail Module Cache summary now shows Downloaded, Uploaded, Download throughput, and Upload throughput.

The per-artifact transfer pipeline is unchanged; throughput is derived from the per-op size + duration already collected. EE companion updated in tuist/TuistCacheEE#68.

T
tuist[bot] Jul 3, 2026

🛠️ Tuist Run Report 🛠️

Tests 🧪
Scheme Status Cache hit rate Tests Skipped Ran Commit
TuistAcceptanceTests 6 % 26 0 26 4c774112d
TuistUnitTests 6 % 3038 5 3033 dddab9c2e
Flaky Tests ⚠️
  • TuistUnitTests: 3 flaky tests (View all)
Test case Module Suite
parseTestStatuses_extractsModuleAndSuiteNames() TuistXCResultServiceTests XCResultServiceTests
parseTestWithCustomLabelXCResult() TuistXCResultServiceTests XCResultServiceTests
parseTestXCResult() TuistXCResultServiceTests XCResultServiceTests
Builds 🔨
Scheme Status Duration Commit
TuistAcceptanceTests 2m 24s dddab9c2e
TuistUnitTests 3m 16s dddab9c2e