 TA
TA
feat(server): build/test duration metrics API + Grafana data source plugin
GitHub issue · Closed
Source
tuist/tuist #11210
Updated
Jun 24, 2026
Purpose
Make build and test run durations queryable as time series with percentile metrics (p50/p90/p99 and average) over a chosen time range, and ship a Grafana data source plugin that consumes them. This came out of a request to measure how much CI pipelines are getting optimized over time and to feed those numbers into Grafana dashboards.
The percentile math already existed internally (it powers the dashboard); the gap was a public, queryable API and a client. This PR closes both.
What changed
Server: build/test duration metrics API
- New
TuistWeb.API.MetricsControllerexposing, per project:GET .../builds/metrics/durationand.../tests/metrics/duration— time-bucketedaverage+p50/p90/p99series..../builds/metrics/schemes,.../builds/metrics/configurations,.../tests/metrics/schemes— to back filter dropdowns and template variables.
- New
Builds.Analytics.build_duration_percentiles_analytics/2returning average + p50/p90/p99 in a single grouped ClickHouse query. The tests equivalent (test_run_duration_analytics/2) already returned this shape and is reused as-is. - New
DurationMetricsOpenApiSpex response schema:{ dates, average{values,total}, p50, p90, p99, trend }, durations in ms, dates as Unix seconds.
New component: grafana-datasource/ — a Grafana data source plugin (Go backend + React), a thin client over the endpoints above:
QueryDatadispatches onqueryType(buildDuration/testDuration) and renders a wide time-series frame (one field per selected series, unit ms). Default series is average + p50/p90/p99, matching the dashboard.CallResource+metricFindQueryproxyGET /api/projectsand the.../metrics/schemes/configurationsendpoints, so query-editor dropdowns and dashboard variables resolve without exposing the token.- Filters: Project and Environment (CI/Local) are both exposed per-panel and as dashboard variables (via
applyTemplateVariables), so one dashboard works across every project the account token can reach, mirroring the builds page filters. Scheme/configuration filters too. ConfigEditorstores the server URL injsonDataand the account token insecureJsonData(encrypted, never sent to the browser).- Built on the standard
@grafana/create-pluginharness. The.config/directory is vendored, auto-generated scaffolding (webpack/jest/eslint/tsconfig + the Docker dev-server) carrying a DO-NOT-EDIT banner and pinned via.config/.cprc.json— it is refreshed withnpx @grafana/create-plugin@latest update, not hand-edited, so it is not worth reviewing line by line. What is actually ours:pkg/(Go backend),src/(React/TS),plugin.json, the root config-extension files, and the release/CI wiring. The Go backend lives in its own nestedgo.work(see SDK isolation below); the component is added to the root AGENTS.md repository map.
Why these choices
- Endpoint placement — the metrics hang off the existing
/buildsand/testsresources behind a/metricsinfix (GitHub{entity}/statsstyle) instead of a dedicated/analyticsnamespace, which is already overloaded by the ingestPOST /analyticsand the page-view AnalyticsPlug. The infix also avoids colliding with/:build_id. - Auth — reuses the existing
AuthorizationPlug(:build/:test), so account tokens withproject:builds:read/project:tests:readwork with no new authorization category. The plugin authenticates with an account token, which gives the account-wide project dropdown for free viaGET /api/projects. - ClickHouse load —
from/tocome from the consumer’s time range; the server derives bucket granularity (hour/day/month) from the range, which bounds the point count (~60 buckets max). A max-range guard rejects ranges over 366 days. Reads go through the read replica (Tuist.ClickHouseRepo). A 60s response cache (KeyValueStore.get_or_update, keyed per project/range/filters) collapses the Grafana refresh storm to one query, and a per-account rate-limit plug (MetricsRateLimitPlug, 300 req/min, in-memory token bucket) caps abuse.build_runsisORDER BY (project_id, inserted_at, id) PARTITION BY toYYYYMM(inserted_at), so each query is an indexed range scan with partition pruning, not a full scan. - Backend plugin (Go, like grafana/sentry-datasource) keeps the token server-side and enables Grafana alerting.
- OpenApiSpex only; the CLI client is intentionally not regenerated (these endpoints are not for the CLI).
How to test locally
Server:
cd server
mix test test/tuist/builds/analytics_test.exs test/tuist_web/controllers/api/metrics_controller_test.exs
Then, with the dev server running, hit (account-token auth):
GET /api/projects/<account>/<project>/builds/metrics/duration?from=<unix>&to=<unix>&is_ci=true
GET /api/projects/<account>/<project>/tests/metrics/duration?from=<unix>&to=<unix>
Plugin:
cd grafana-datasource   # Node pinned to 24 via mise.toml
npm install
npm run typecheck && npm run lint && npm run build
go build ./... && go test ./...
Validation run
- Server: 2 new analytics unit tests + 8 controller tests (user and account-token paths,
is_cifilter, 400 range validation, 403 forbidden); full builds-analytics + controller suites green (80 tests). Compiles with--warnings-as-errors, credo clean. - Plugin backend:
go build/go vet/go testgreen, gofmt clean. - Plugin frontend:
npm run typecheck,npm run lint(0 errors),npm run build(production) all green against@grafana/*12.4.2. - End to end against a running Grafana → plugin → local server: datasource health “Connected to Tuist”; queries return real series (build p50 ~38s / p90 ~89s / p99 ~99s); the Environment filter changes results (CI ~41.6s vs Local ~35.0s); switching Project changes the series. CI coverage for the backend is mocked (
httptest):CallResourcepath dispatch +CheckHealthscope validation indatasource_test.go, frame building inframes_test.go.
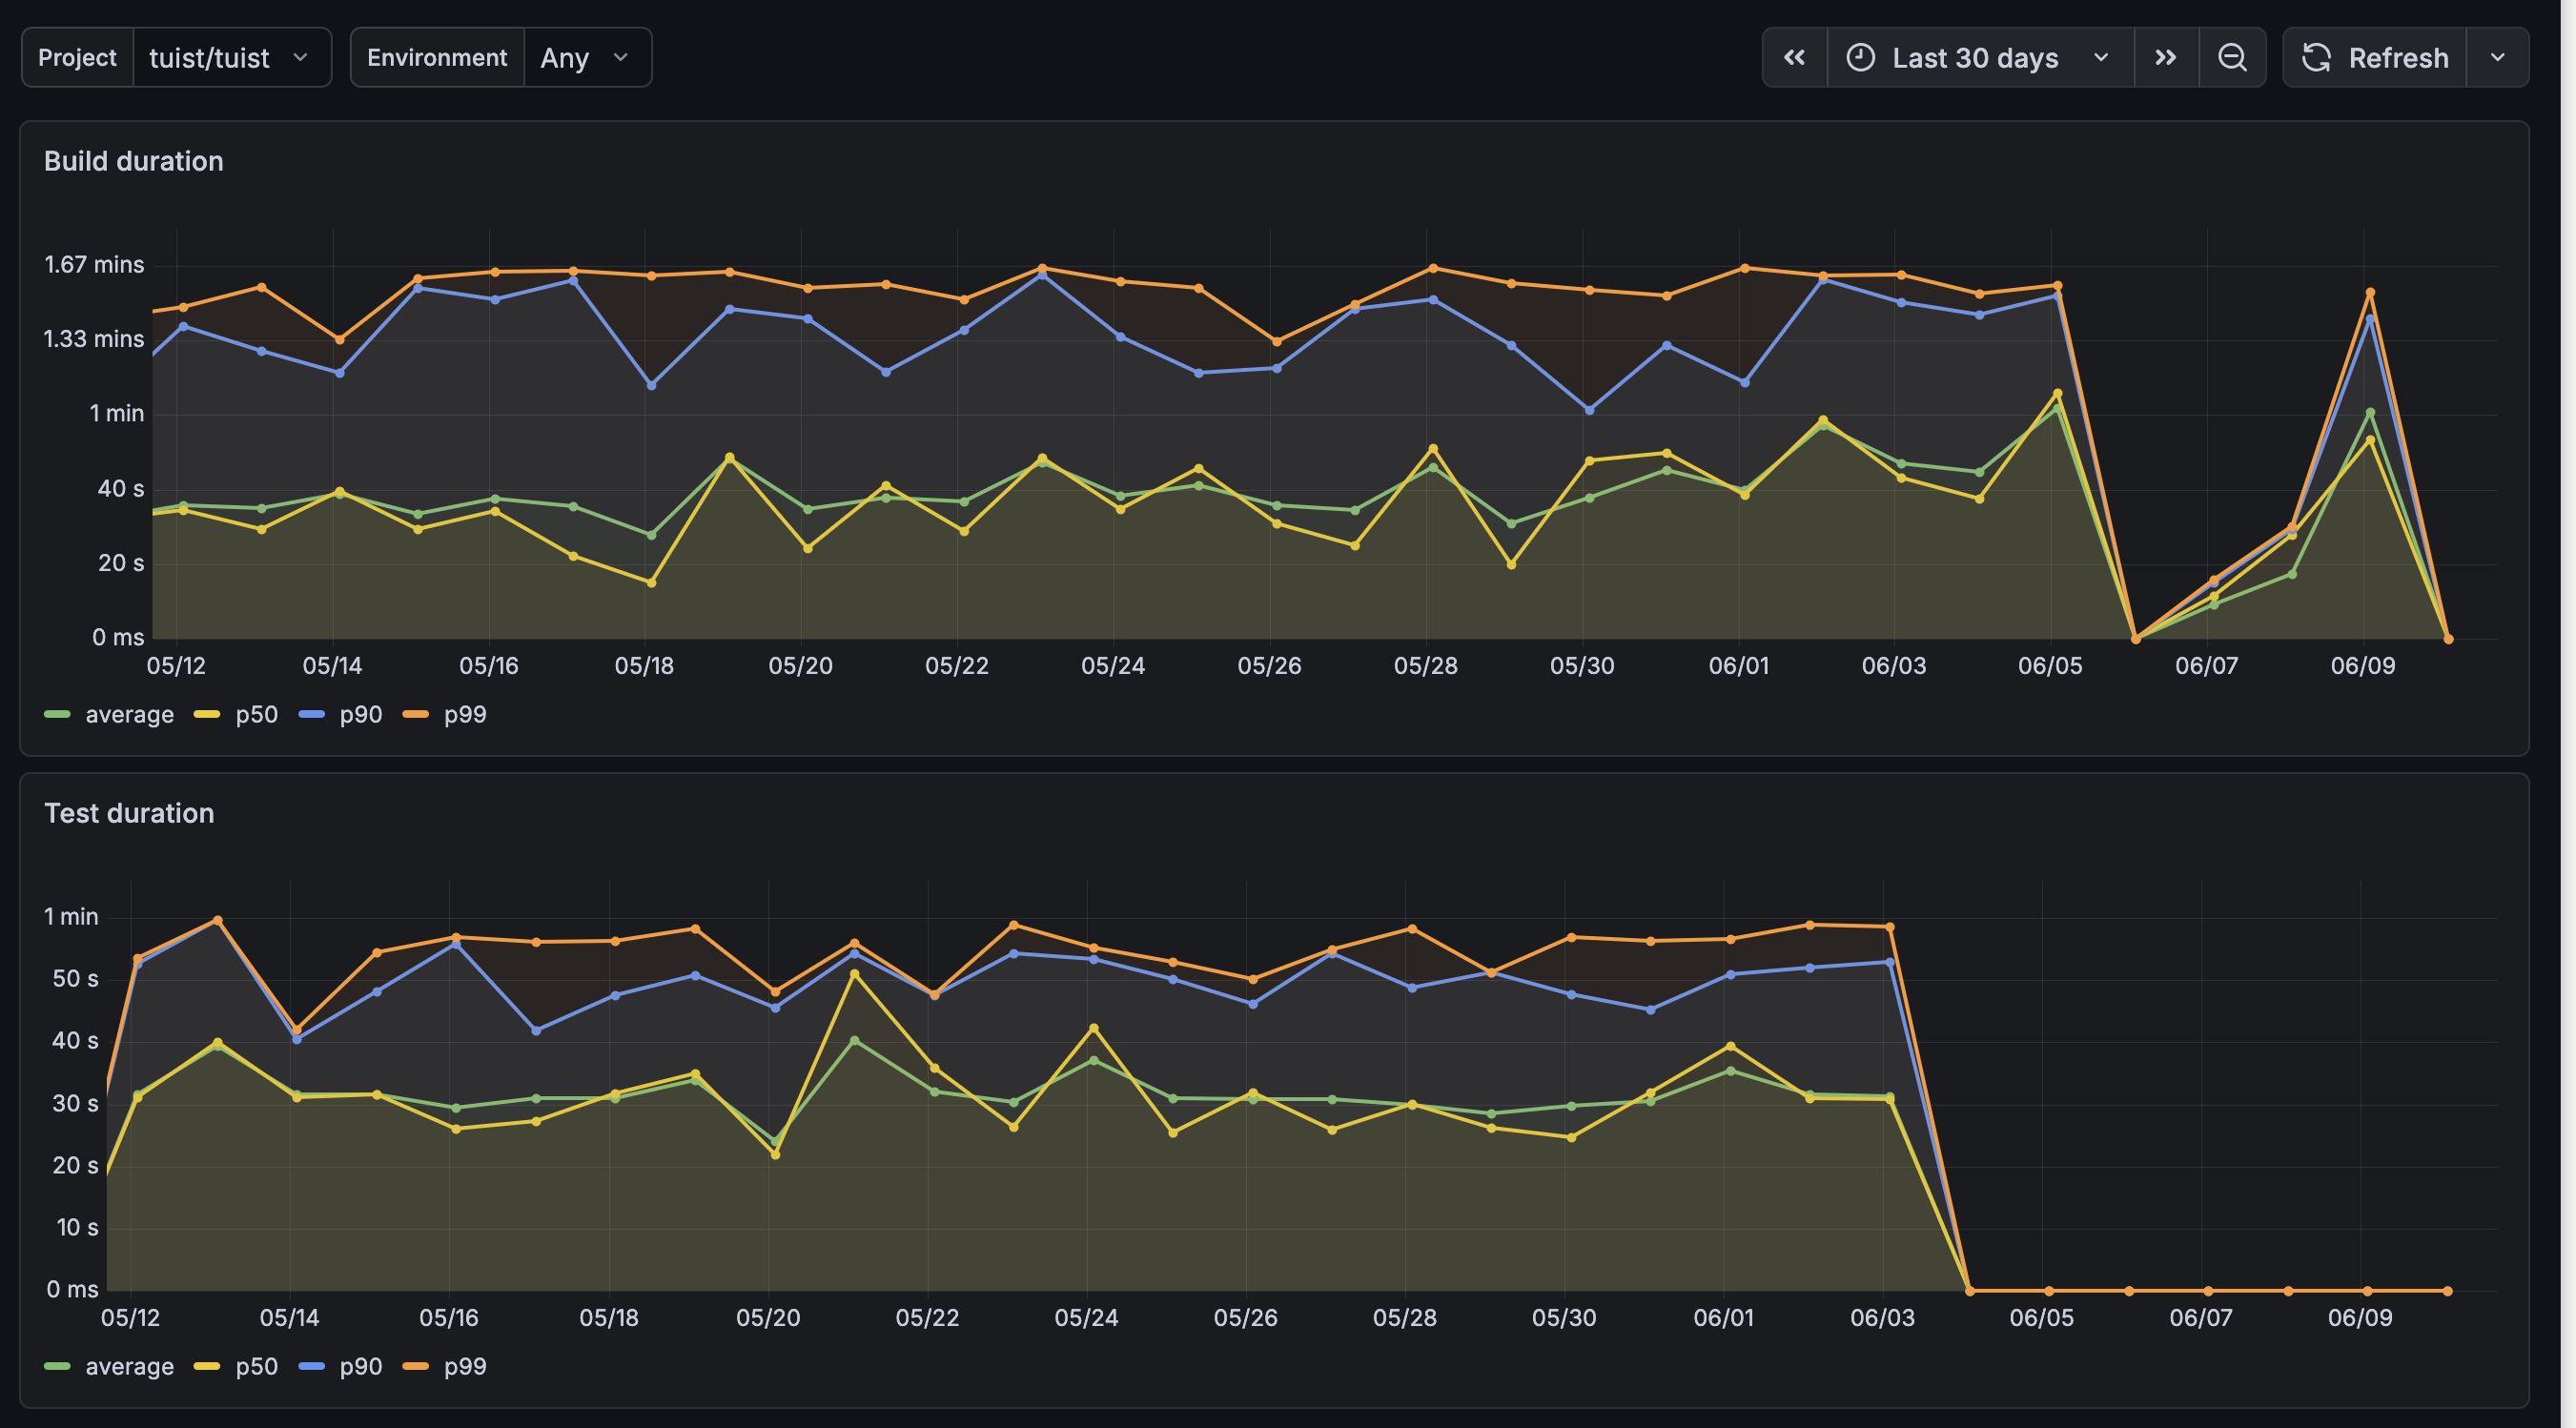
Screenshot
The Grafana dashboard rendering build and test duration percentiles (average, p50, p90, p99) from a Tuist server, with the Project and Environment filters as dashboard variables:
A marketing changelog entry ships with this change at server/priv/marketing/changelog/2026.06.10-grafana-data-source.md.
Follow-ups (not in this PR)
- Grafana catalog signing/publishing.
- Optional
build_runs/test_runsdaily-stats materialized views if raw scans get hot.
Publishing the plugin
Prepared in this PR (catalog readiness, verified with @grafana/plugin-validator):
plugin.jsonwith the catalog 3-part idtuist-metrics-datasource, the Tuist logo, a dashboard screenshot, and description/keywords/links.- A catalog README (what it does, requirements, configuration, and unsigned/private/catalog install paths) with absolute image/link URLs.
- Release wiring follows the repo convention (git-cliff + push-to-main, like every other component):
grafana-datasourceis registered inmise/tasks/release/components.jsonwith its owncliff.toml, and.github/workflows/grafana-datasource-release.ymltriggers on a push tomaintouchinggrafana-datasource/**, computes the next version with git-cliff, and — only when there are releasable commits — builds the frontend + multi-platform Go binaries, signs whenGRAFANA_ACCESS_POLICY_TOKENis set, validates, tagsgrafana-datasource@x.y.z, and publishes a GitHub release with the zip + SHA1. Checks run separately on PRs in.github/workflows/grafana-datasource.yml(typecheck/lint/test/build for the frontend, gofmt/vet/test for the backend), one job per check, mirroring the other components.
Post-merge / pre-submission (need a grafana.com account + maintainer action, so not doable in the PR):
- Register/confirm the
tuistorg on grafana.com — the plugin id prefix must match it. - Create a
GRAFANA_ACCESS_POLICY_TOKEN(plugins:write) and add it to repo secrets — do this before merge if you want the first release signed. - Merging this PR auto-releases
grafana-datasource@0.1.0(push-to-main, via the workflow above): signed if the token from step 2 is set, otherwise an unsigned build. Laterfeat:/fix:commits touching the plugin bump it automatically. - Submit at grafana.com → My Plugins → Submit New Plugin (zip URL + SHA1 + public source URL). Grafana reviews (code + security + install testing), grants the Community signature, and lists it.
SDK / dependency isolation: the plugin lives in its own go.work (use ., go 1.26.3), separate from the repo-root infra workspace, so it tracks the latest grafana-plugin-sdk-go without forcing its k8s/transitive deps onto the infra controllers (sharing the workspace had broken their build via MVS — apimachinery structured-merge-diff v4-vs-v6). With the latest SDK, @grafana/plugin-validator no longer flags the “SDK older than 5 months” check or the grpc/otel/kin-openapi CVEs. Verified: the plugin builds and tests on go 1.26.3 with the latest SDK, and the infra modules build unchanged.
Using it before the catalog listing: self-hosted Grafana via the unsigned allowlist (GF_PLUGINS_ALLOW_LOADING_UNSIGNED_PLUGINS=tuist-metrics-datasource) or a private signature; Grafana Cloud needs the published catalog version.